Client: Ministry for the Environment
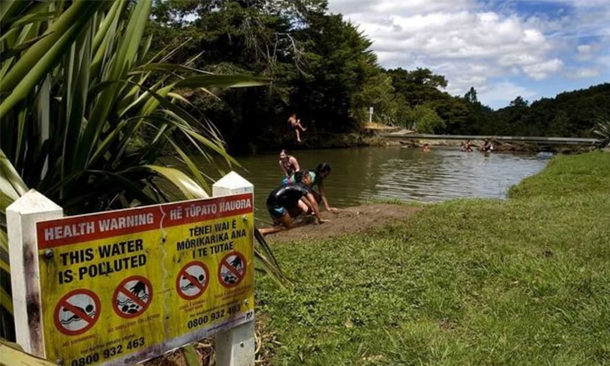
Photo source: RNZ
We’ve long been a nation that has valued freshwater, but this precious resource is now under threat.
In 2020, The Ministry for the Environment and Statistics New Zealand published the report, our freshwater 2020 which highlighted four key issues facing our freshwater ecosystems: 1. our native freshwater species being under increasing threat due to: 2. water pollution in urban, farming, and forestry landscapes, in combination with: 3. changing water flows and: 4. climate change exacerbating these pressures.
As a result, the Government freshwater work programme was launched which includes a series of projects aimed to restore and protect the health of our waterways. One of those is the at-risk catchment (ARC) project. Morphum Environmental came on board to develop a national scale model to inform the prioritisation of investment in protecting, enhancing, or restoring freshwater ecosystems.
Designing for complexity
The model was structured to account for the complex and dynamic relationships across human drivers and pressures, biophysical character and climatic conditions – all of which influence the nature and health of a catchments ecology and which are unique to each catchment.
The model components and the data sets used to populate them were informed by a robust literature review which sought to confirm the requisite simplicity of the causal relationships across this inherent complexity.
The semi-quantitative GIS model includes a total of 39 indicators that represent the elements within four modules: drivers and pressures, biophysical and climatic modifiers, freshwater ecosystem health, and health of other systems (lakes, wetlands, estuaries).
The model is developed with an unweighted data contribution (apart from ecosystem health), but these can be altered to generate different scenarios based on the emphasis and weighting placed on different parameters.
The model also integrates temporal effects via trend analysis of aquatic health, climate change scenarios and future land use in the drivers and pressures module.
Unique risk scoring of catchments
The primary output of the model is the risk map pictured below.
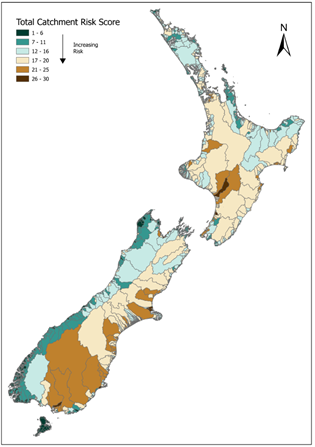
The map presents an overall risk score which shows a cumulative understanding of catchment risk. These are generated by the combined scores across drivers, pressures, effects, and the consequent state of freshwater ecosystems in each catchment.
The risk score is unique to each catchment and allows for a comparison of risk across catchments. It is a relative score and does not provide an index of catchment health, nor does it provide any indication of a ‘tipping point’ for a catchment.
Peer review by the Cawthron Institute, found the model to be “appropriate, repeatable, and effective in representing catchment risk” at a national scale.
Deep diving and flexibility
In addition to the overall risk ranking, the model enables the investigation of the key factors driving risk, in and between catchments in the same risk category and thereby allows for more detailed querying of the overall layer to inform the response.
The model is also flexible. The modular design enables the addition and update of data sets. It is also scalable and able to rank catchments on national, regional and local scales. It could be adapted to run different scenarios, such as the influence of mitigation or best practice land use in reducing risk. The accompanying report concluded with recommendations for addressing data limitations and gaps, but also for building additional functionality and testing the model at sub national scale.
In addition to focusing investment available for catchment restoration, the associated report provides guidance for addressing the gaps in information and understanding that will enhance the value of the model at varying scales across New Zealand.